Here's a Map of the Most and Least Hateful States

By:
The rate of hate crimes in America is at a record low — the lowest point in nearly two decades, in fact. But a recent rise in anti-Islamic incidents in the aftermath of Islamic State group-related attacks in France demonstrates that hate crime remains a critical problem in the country.
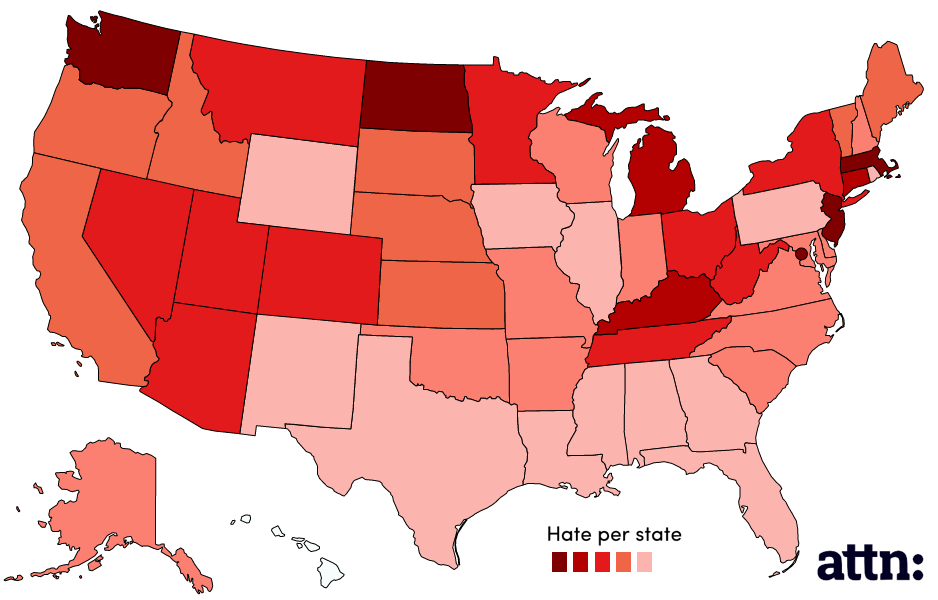
There is a greater concentration of hate groups in the Deep South, ATTN: previously reported. But the rate of hate crimes is actually lowest in Southern states (as measured by incidents per 100,000 citizens), according to data from the FBI Uniform Crime Report.
The states with the highest rate of hate crimes are dispersed throughout the U.S., with the District of Columbia ranking at the top of the chart.
Here's a map of hate crime rates per state in the U.S.

After D.C., the states with the highest rate of hate crimes are as follows: North Dakota, Massachusetts, Washington, New Jersey, Kentucky, Connecticut, Michigan, Ohio, and Tennessee.
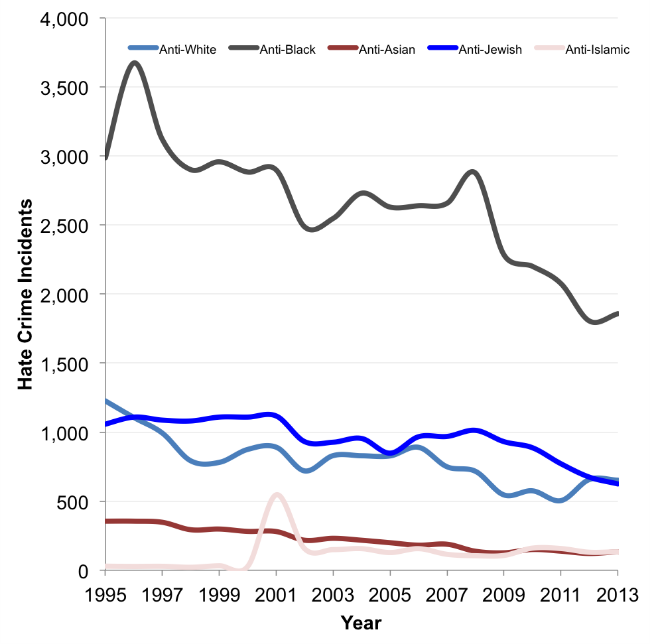
Another trend identified in the federal report is the type of hate crimes that have been reported since 1995. The most recent data from the FBI come from 2013 — before the insurgence of the self-styled Islamic State group but after the 9/11 terrorist attacks. They show that anti-Islamic attacks spiked in 2001 and remain well above levels reported prior to the attack in New York.
 Samuel Bennett - samuelwbennett.com
As it stands — and as it has stood for most of American history — anti-Black hate crimes continue to represent the largest fraction of those reported in the U.S. Even if the data are encouraging in showing a decline in overall hate crimes, there's clearly more work to be done, civil rights advocates say.
