Chart Shows When You'll Start Feeling Old
By:
Remember elementary school, when middle schoolers seemed like giants? And high school, when college students were more mythic creatures of adulthood rather than the rowdy youths they actually are?
Our perceptions of how young or old others around us are — and how we fit in — differ, obviously, depending on how old we are. But is there a point at which the majority of people feel younger or older? Nathan Yau, over at Flowing Data, wanted to find out.
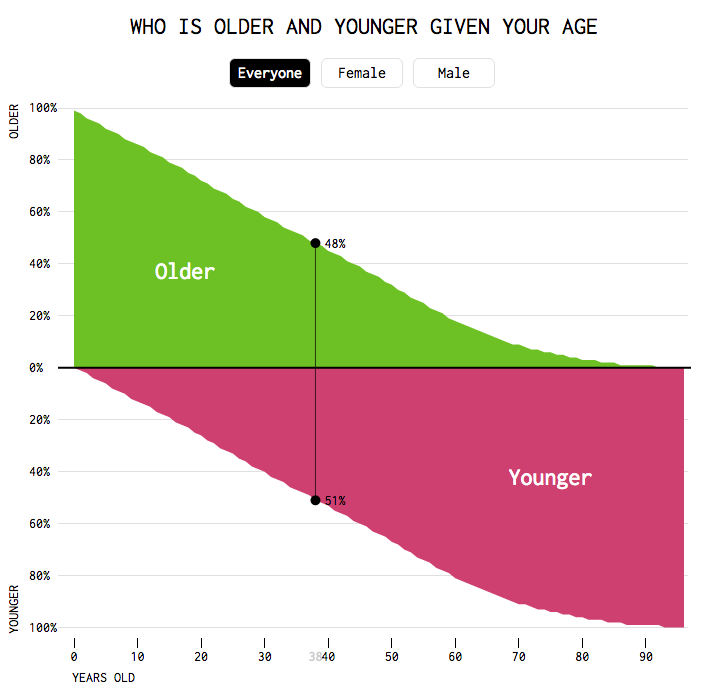
Yau created an interactive chart that lets you see who is older and younger, depending on your current age.
Using 2014 data from the American Community Survey, Yau's chart lets you estimate at what age you might start to feel like you're older than those around you. Turns out it's sometime around 37 or 38, the magic number at which a larger percentage of Americans will be younger than you, according to the chart.
 Flowing Data - flowingdata.com
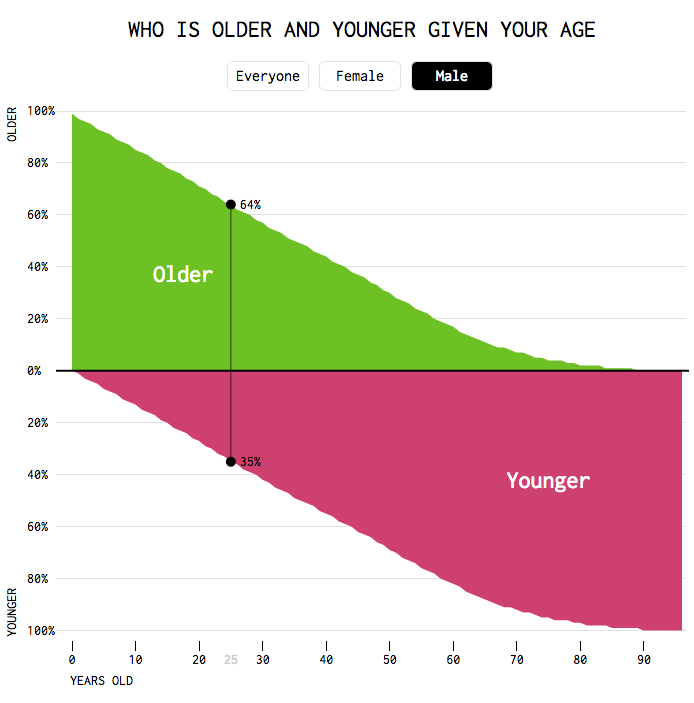
The chart also lets you isolate the results depending on sex.
For a 25-year-old male, for example, a majority of the population is older. But that gap gets smaller as time progresses.
 Flowing Data - flowingdata.com
Age can be a social and personal construct too.
Yau's chart uses population data and hard age demographics to give a sense of when you should theoretically start feeling "old." But other studies indicate that external pressures like social expectations or cultural standards of beauty can have a strong influence on when we feel old. One somewhat disconcerting study from 2011 found that women "consider themselves old by the time they reach 29," while men said they felt old closer to age 58. Women in the study cited spotting grey hairs, "sagging," and acting like their mother, as signs of being old. Men, on the other hand, cited lagging bedroom performance and too-loud music in bars.
Scientists have also found that our psychological perception of age can influence our physical bodies. According to research published by the American Psychological Association, people who feel older than their peers are more likely to be hospitalized as they age, regardless of their actual age or other demographic factors.
To see where you fit it, check out the chart on Flowing Data.
